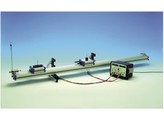
The volocities of two gliders, moving without friction on a demonstration track, are measured before and after collision, for both elastic and inelastic collision.
Tasks
1. Elastic collision
The impulses of the two gliders as well as their sum after the collision. For comparison the mean value of the impulses of the first glider is entered as a horizontal line in the graph.
Their energies, in a manner analogous to Task 1.1
In accordance with the mean value of the measured impulse of the first glider before the collision, the theoretical values of the impulses for the two gliders are entered for a range of mass ratios from 0 to 3. For purposes of comparison the measuring points (see 1.1) are plotted in the graph.
In accordance with the mean value of the measured energy of the first glider before the collision, the theoretical values of the energy after the collision are plotted analogously to Task 1.3. In the process, the measured values are compared with the theoretical curves.
2. Inelastic collision
The impulse values are plotted as in Task 1.1.
The energy values are plotted as in Task 1.2.
The theoretical and measured impulse values are compared as in Task 1.3.
As in Task 1.4, the theoretical and measured energy values are compared. In order to clearly illustrate the energy loss and its dependence on the mass ratios, the theoretical functions of the total energy of both gliders and the energy loss after the collision are plotted.
What you can learn about
Conservation of momentum
Conservation of energy
Linear motion
Velocity
Elastic loss
Elastic collision
Properties
- P2130505
- P2130505

